Getting started with tracing in Effect
I’m brushing up on Effect lately to help tackle complex app requirements around async code, concurrency, error handling, and other scaling challenges. One such challenge is observability—as a backend program grows and spins up more concurrent tasks, it’s hard to diagnose issues from logs alone. Effect’s observability, particularly its tracing features, facilitate a better understanding of what’s happening inside the black box of a program. This is increasingly important as programs are becoming more dependent on nondeterminstic systems like language models.
In an environment where nondeterminism is the default, we believe Effect is the antidote … The way we combat non determinism in these systems is by making observability a first class citizen.
Effect has baked-in support for recording traces and metrics so you can explore each step of your program in visual tools akin to what you’d find in the browser’s dev tools. Obsersability isn’t a new thing, but Effect makes it highly composable.
Learning the tools
Effect Playground
The quickest way to start observing Effect programs is inside the
Effect Playground, which includes a fancy
OpenTelemetry visualizer in the “Trace Viewer” tab. This uses the same socket
communication mechanism as
Effect Dev Tools
within the playground’s WebContainer, handled by the DevToolsLive layer
provided in their boilerplate.
      import { NodeRuntime } from "@effect/platform-node"
import { Effect } from "effect"
import { DevToolsLive } from "./DevTools"

const program = Effect.gen(function* () {
	yield* Effect.log("Welcome to the Effect Playground!")
}).pipe(
	Effect.withSpan("program", {
		attributes: { source: "Playground" },
	}),
)

program.pipe(Effect.provide(DevToolsLive), NodeRuntime.runMain)
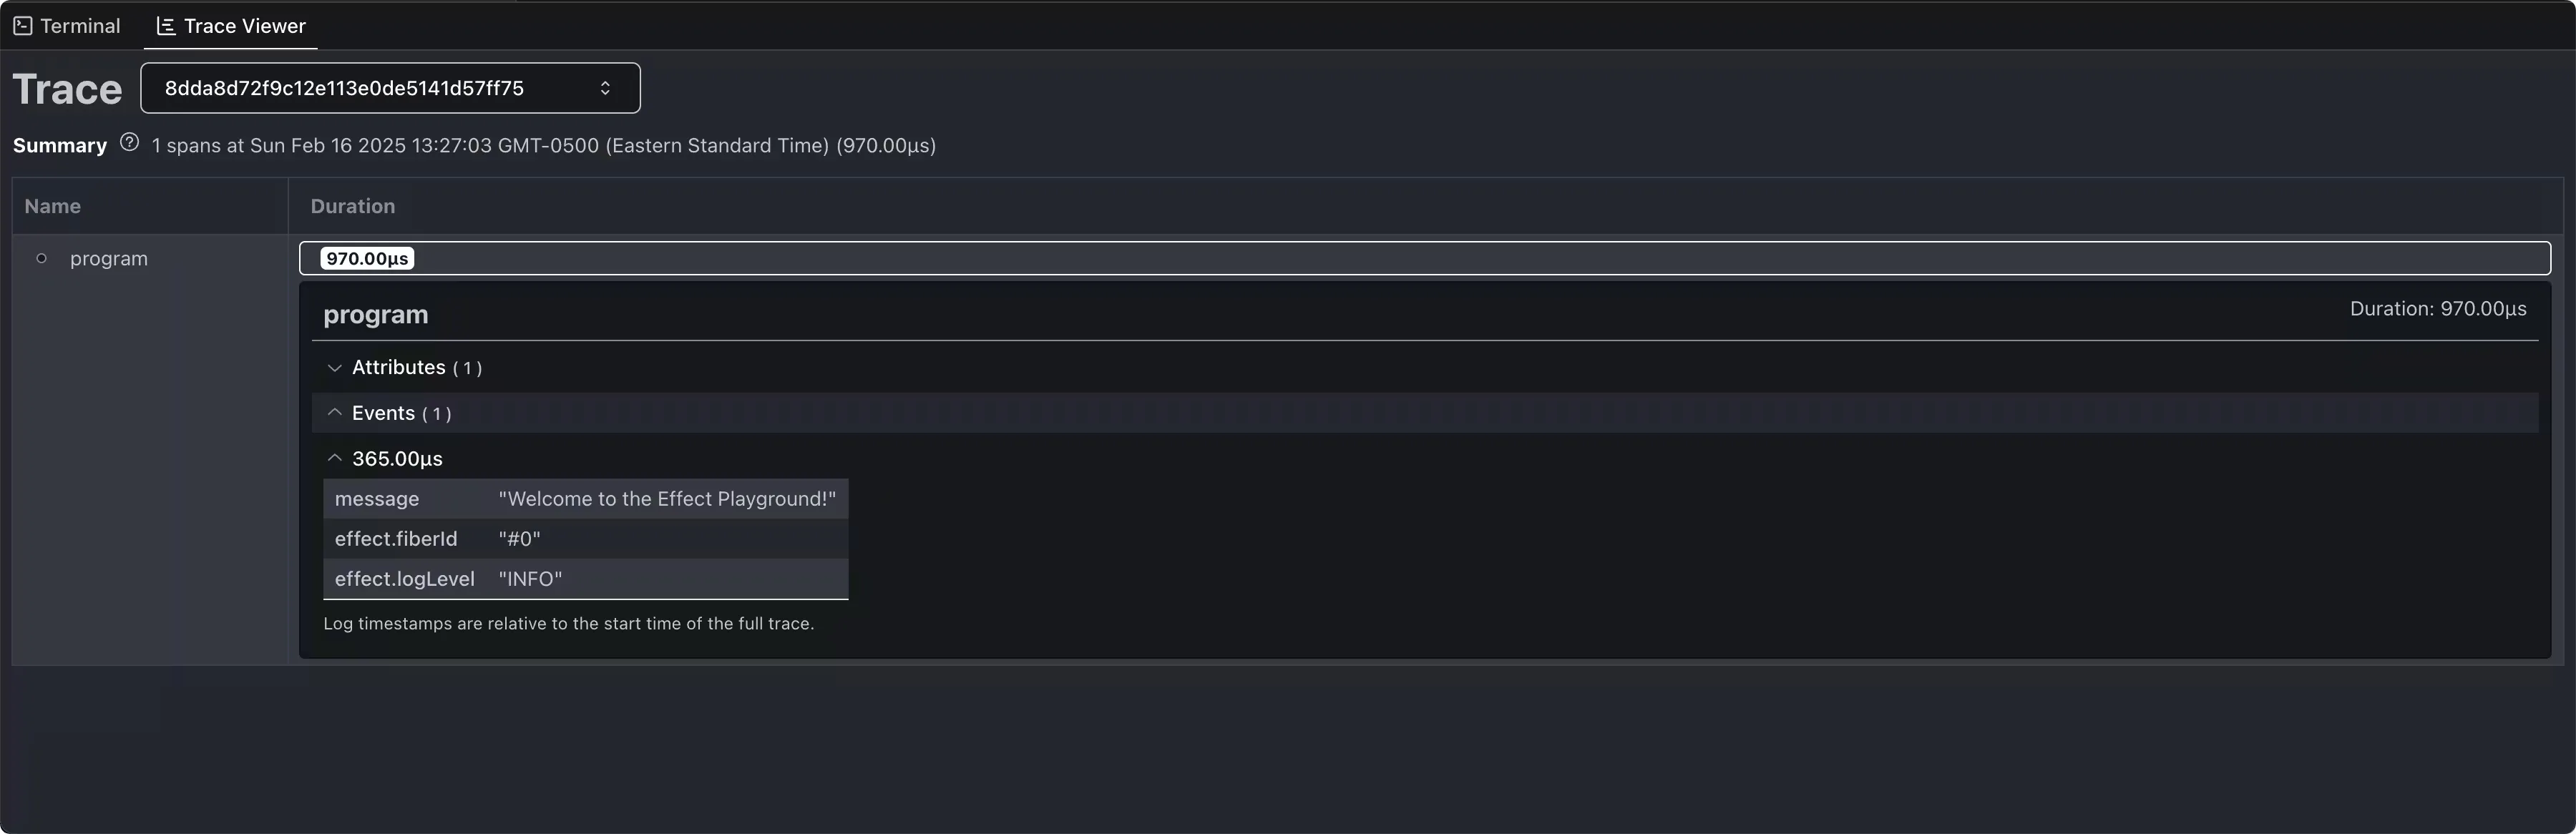
In my experience this can be buggy—let the WebContainer finish intializing and executing the program once before trying to open the Trace Viewer, otherwise it may get stuck being unable to record traces.
Effect Dev Tools
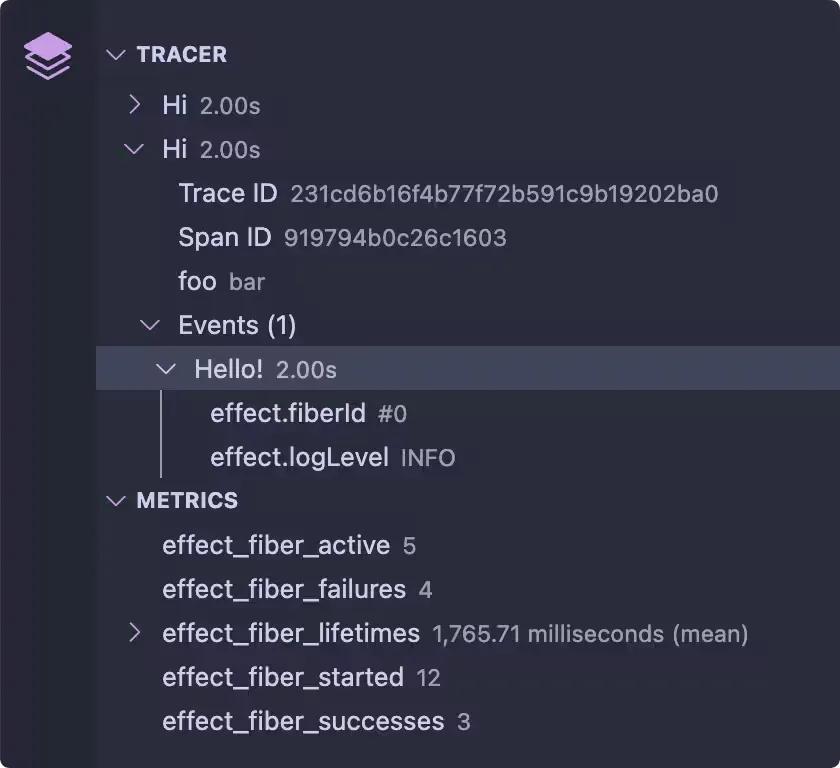
As mentioned above, the Effect Playground leverages a similar protocol as Effect Dev Tools.
I was hoping this would mean I could generate the same helpful trace visualizations from the Effect Playground in VSCode, but the VSCode extension reports these traces as dropdowns in the sidebar which I find harder to interpret. While this is a simple way to start observing Effect programs locally, I prefer visuals from the other solutions.
OpenTelemetry
Effect’s observability slots neatly into OpenTelemetry standards, which lets you inspect traces and other signals using a broad ecosystem of tools. It’s a bit more involved to set up, but the end result gives you a ton of visibility into your program.
There’s a few pieces to get this working:
- A backend with an OTLP (OpenTelemetry Protocol) compatible endpoint, provided by tools such as Jaeger or Grafana Tempo
- A program that sends trace information to that endpoint using an OpenTelemetry SDK and/or instrumentation library
- A tool for visualizing observability data (which might come bundled with your OpenTelemetry backend) like Jaeger UI or Grafana
The OpenTelemetry SDK lets you choose a
span processesor
which determines how span data should be processed before sending. Usually
you’ll want to use BatchSpanProcessor to reduce how often you’re submitting
data over the network, but you also have the option to process every span
individually with SimpleSpanProcessor. You’ll also pick a
span exporter which
determines where span data should get sent. A simple way to start viewing traces
is printing their data to the console, but usually it’s nicer to send them to an
OpenTelemetry backend to enable richer visualization and querying.
On the Effect side, @effect/opentelemetry provides the glue between these OpenTelemetry primitives and Effect’s observability primitives. This is the only Effect-specific piece, the other components come from generic OpenTelemetry JavaScript libraries.
This example configures Effect to print spans to the console using
ConsoleSpanExporter:
      import { NodeSdk } from "@effect/opentelemetry"
import { ConsoleSpanExporter, BatchSpanProcessor } from "@opentelemetry/sdk-trace-base"

const TracingToConsole = NodeSdk.layer(() => ({
	resource: { serviceName: "effect" },
	spanProcessor: new BatchSpanProcessor(new ConsoleSpanExporter()),
}))

program.pipe(
	Effect.provide(TracingToConsole)
	NodeRuntime.runMain
)
Whereas to send them to OpenTelemetry backend swap this for OTLPTraceExporter.
By default this sends data to the standard OpenTelemetry HTTP URL at
http://localhost:4318/v1/traces but you can provide a custom url and
headers if connecting to a remote endpoint.
      import { NodeSdk } from "@effect/opentelemetry"
import { BatchSpanProcessor } from "@opentelemetry/sdk-trace-base"
import { OTLPTraceExporter } from "@opentelemetry/exporter-trace-otlp-http"

const TracingToOTLP = NodeSdk.layer(() => ({
	resource: { serviceName: "effect" },
	spanProcessor: new BatchSpanProcessor(new OTLPTraceExporter()),
}))

program.pipe(
	Effect.provide(TracingToOTLP)
	NodeRuntime.runMain
)
For this to record traces, you need to have an OTLP compatible endpoint running.
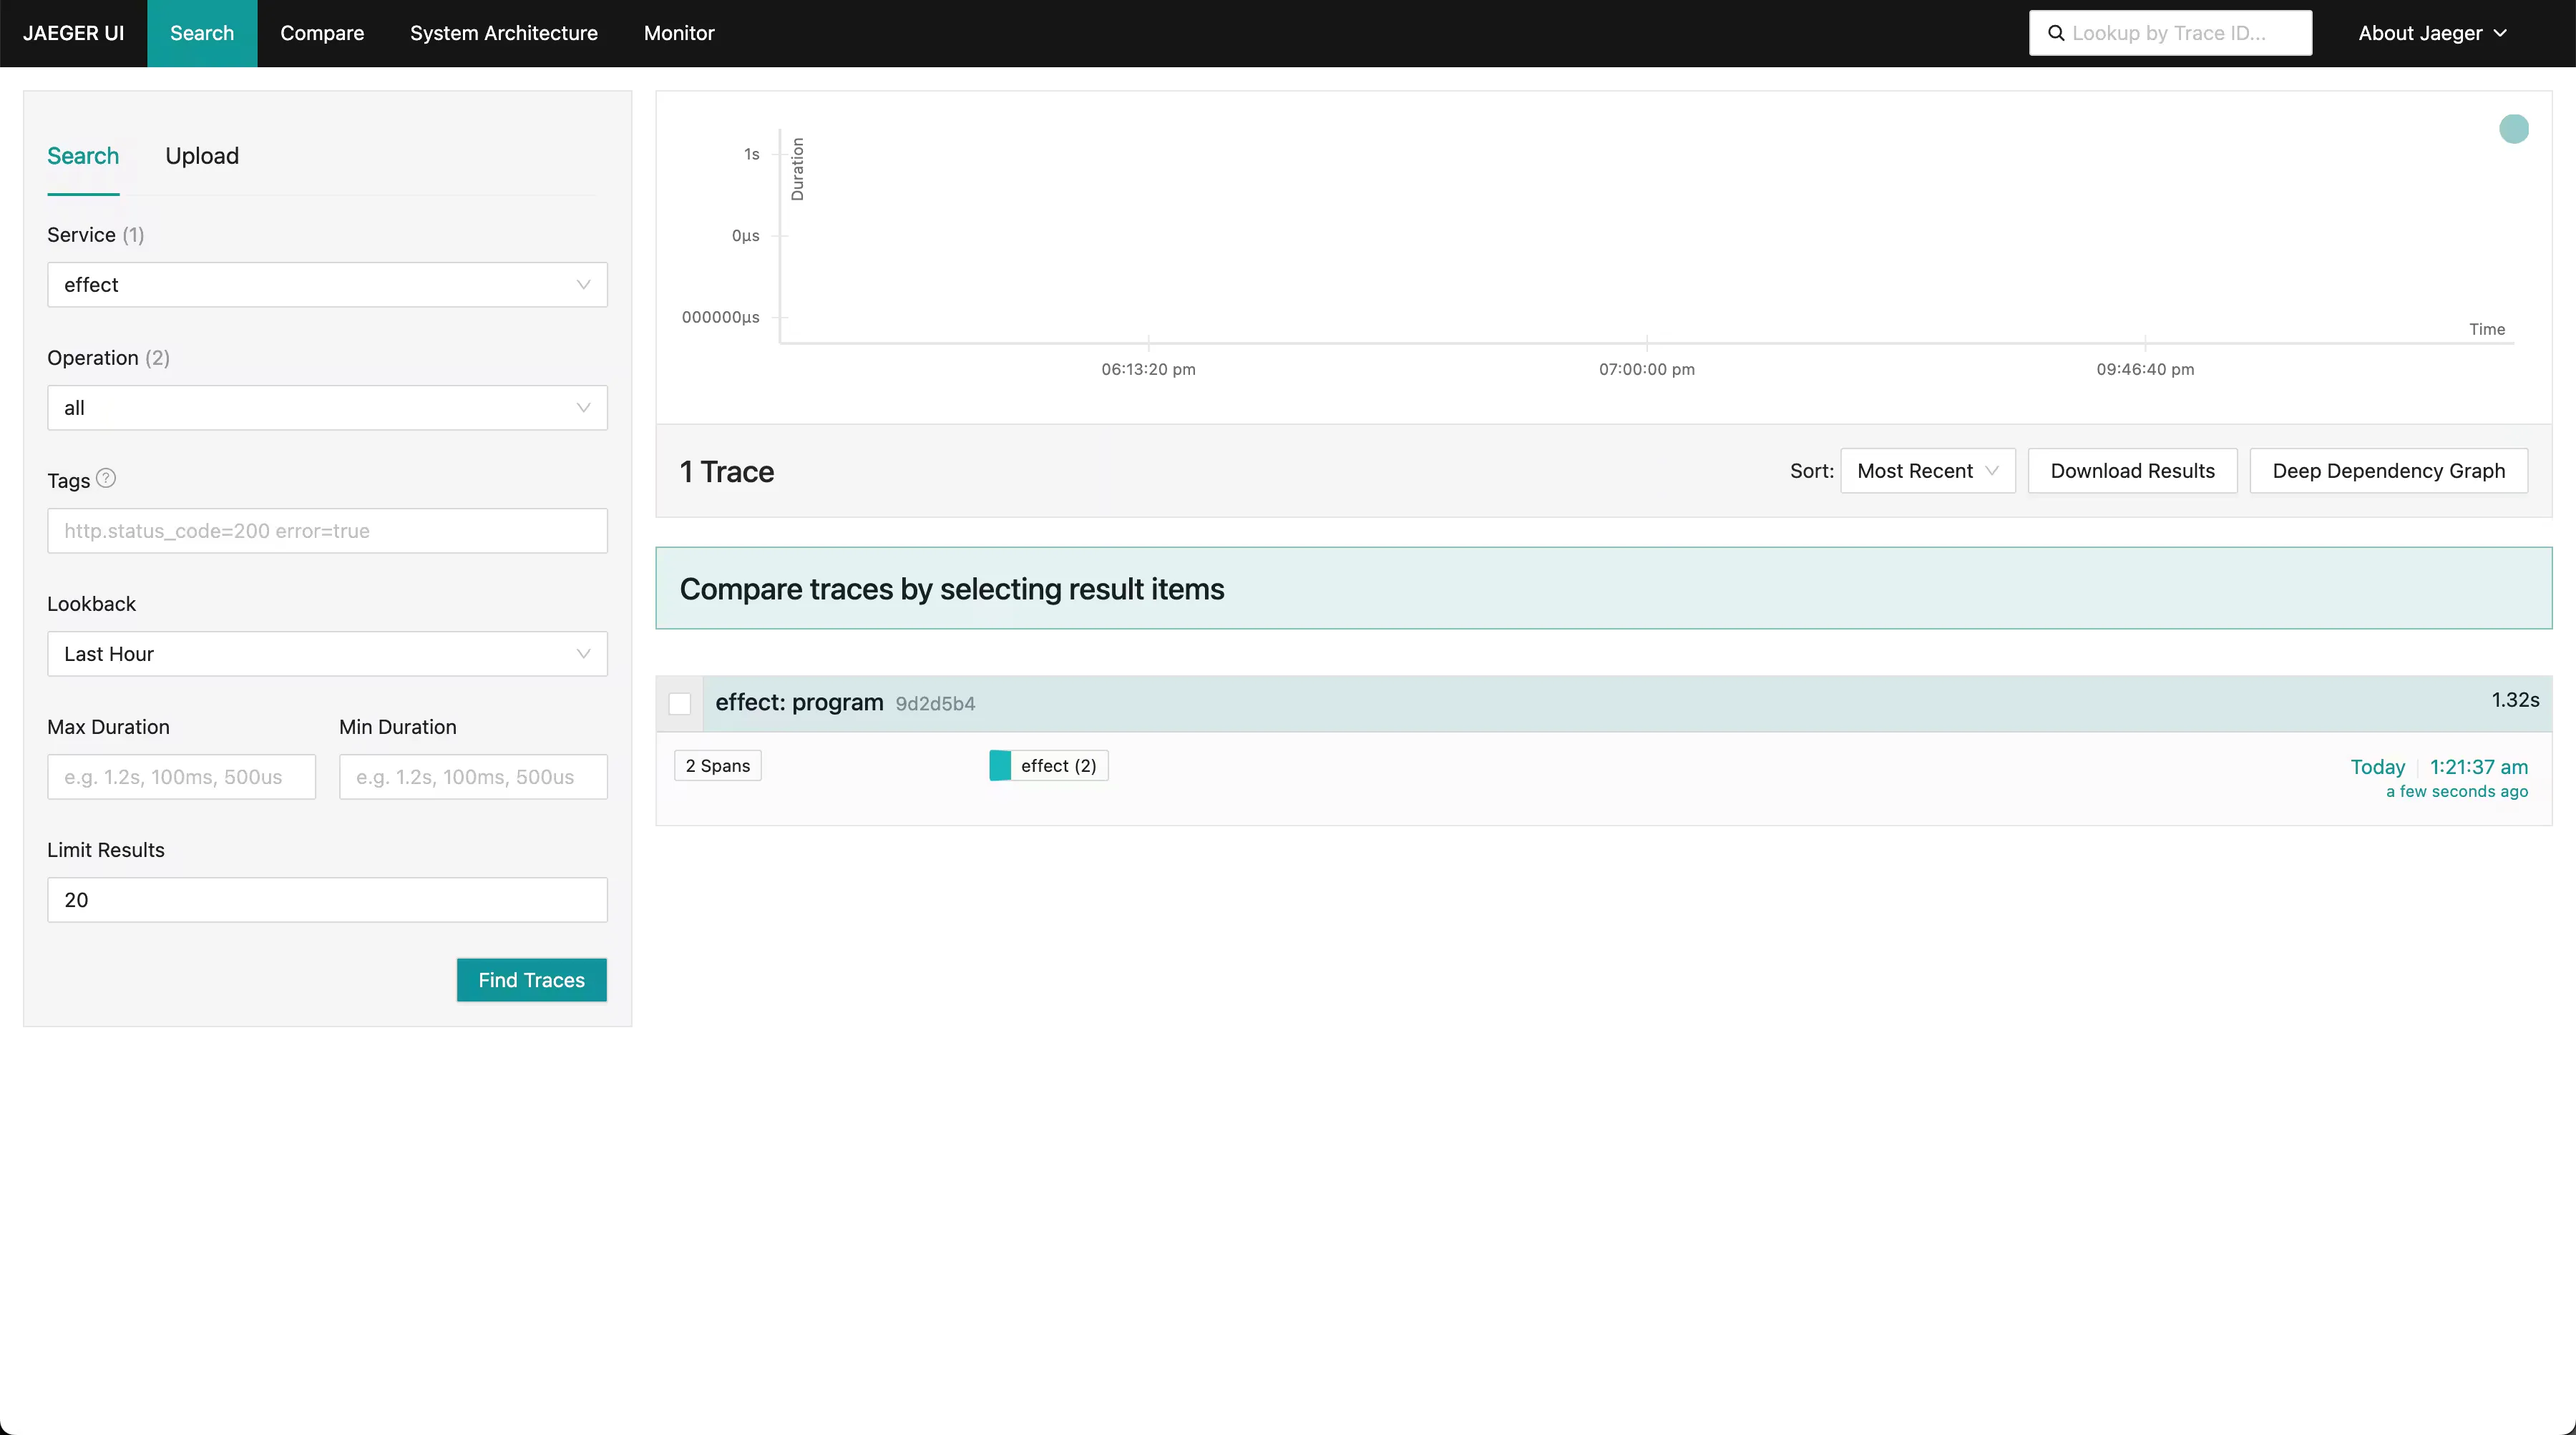
Jaeger provides an all-in-one docker container with the tools you need to gather and visualize OpenTelemetry data.
Assuming you have Docker installed, run the following and then access the Jaeger
UI at http://localhost:16686. After sending data to
it later, you’ll be able to select your chosen service name from the “Service”
dropdown and click “Find Traces” to see recent traces.
      docker run --rm --name jaeger \
  -p 16686:16686 \
  -p 4317:4317 \
  -p 4318:4318 \
  -p 5778:5778 \
  -p 9411:9411 \
  jaegertracing/jaeger:2.3.0
 |  |
Another option suggested by the
Effect tracing docs
is to use a combination of Prometheus (for storing metrics), Tempo (for storing
traces), and Grafana (for visualizing metrics/traces). Setting these up
individually gets a little clunky, but there’s a similar
all-in-one Docker image available
to get it up and running, with Grafana UI visible on
http://localhost:3000
docker run -p 3000:3000 -p 4317:4317 -p 4318:4318 --rm -ti grafana/otel-lgtm
The Prometheus/Tempo/Grafana combo is bulkier (the image weighs in at over 2 GB compared to Jaeger’s 150 MB) but provides more capabilities around tracking different kinds of signals. I find Jaeger more intuitive to navigate for simple tracing.
Tracing Effect programs
Spans
Wrapping an effect in a span lets you observe when the effect starts and ends, detect errors, and other data throughout its execution.
Effect.sleep(1000).pipe(Effect.withSpan("foo"))
You can annotate the span with key/value attributes, either at creation time or during effect execution.
// Add attributes when creating the span
Effect.sleep(1000).pipe(Effect.withSpan("foo", { bar: "baz" }))
// Add attributes during effect execution
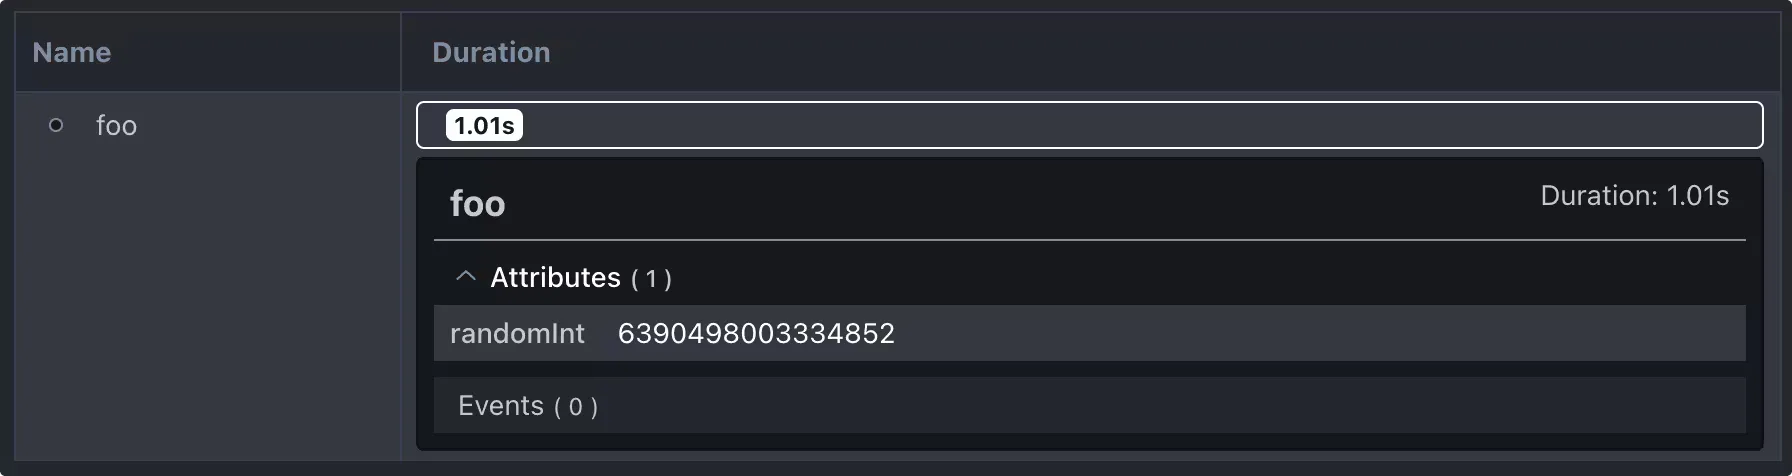
Random.nextInt.pipe(
Effect.delay("1 second"),
Effect.andThen((randomInt) =>
Effect.annotateCurrentSpan("randomInt", randomInt),
),
Effect.withSpan("foo"),
)
These appear in the “Attributes” section of the trace visualizer, though this section might have a different name like “Tags” depending on the visualizer.
If you annotate the same attribute multiple times, it will be overwritten to the latest value.
      Effect.gen(function* () {
	yield* Effect.annotateCurrentSpan("value", "initial value")
	yield* Effect.annotateCurrentSpan("value", "latest value")
	// The "value" attribute will read "latest value"
}).pipe(Effect.withSpan("foo"))
When possible, use Effect.fn to define functions that return Effects. This improves stack traces, and when you provide a name for these functions, it automatically creates a span upon invocation. You may wish to annotate the span with the function arguments to help with monitoring.
      const myTask = Effect.fn("myTask")(function* (
	duration: Duration.DurationInput,
	fail = false,
) {
	// Annotate with arguments to help debug the span later
	yield* Effect.annotateCurrentSpan("duration", duration)
	yield* Effect.annotateCurrentSpan("fail", fail)

	yield* Effect.sleep(duration)

	if (fail) {
		yield* Effect.fail("boom!")
	}
})

const program = Effect.gen(function* () {
	yield* myTask(200)
	yield* myTask(100)
	yield* Effect.all([myTask(400), myTask(100, true)], {
		concurrency: "unbounded",
	})
	yield* myTask(150)
}).pipe(Effect.withSpan("program"))
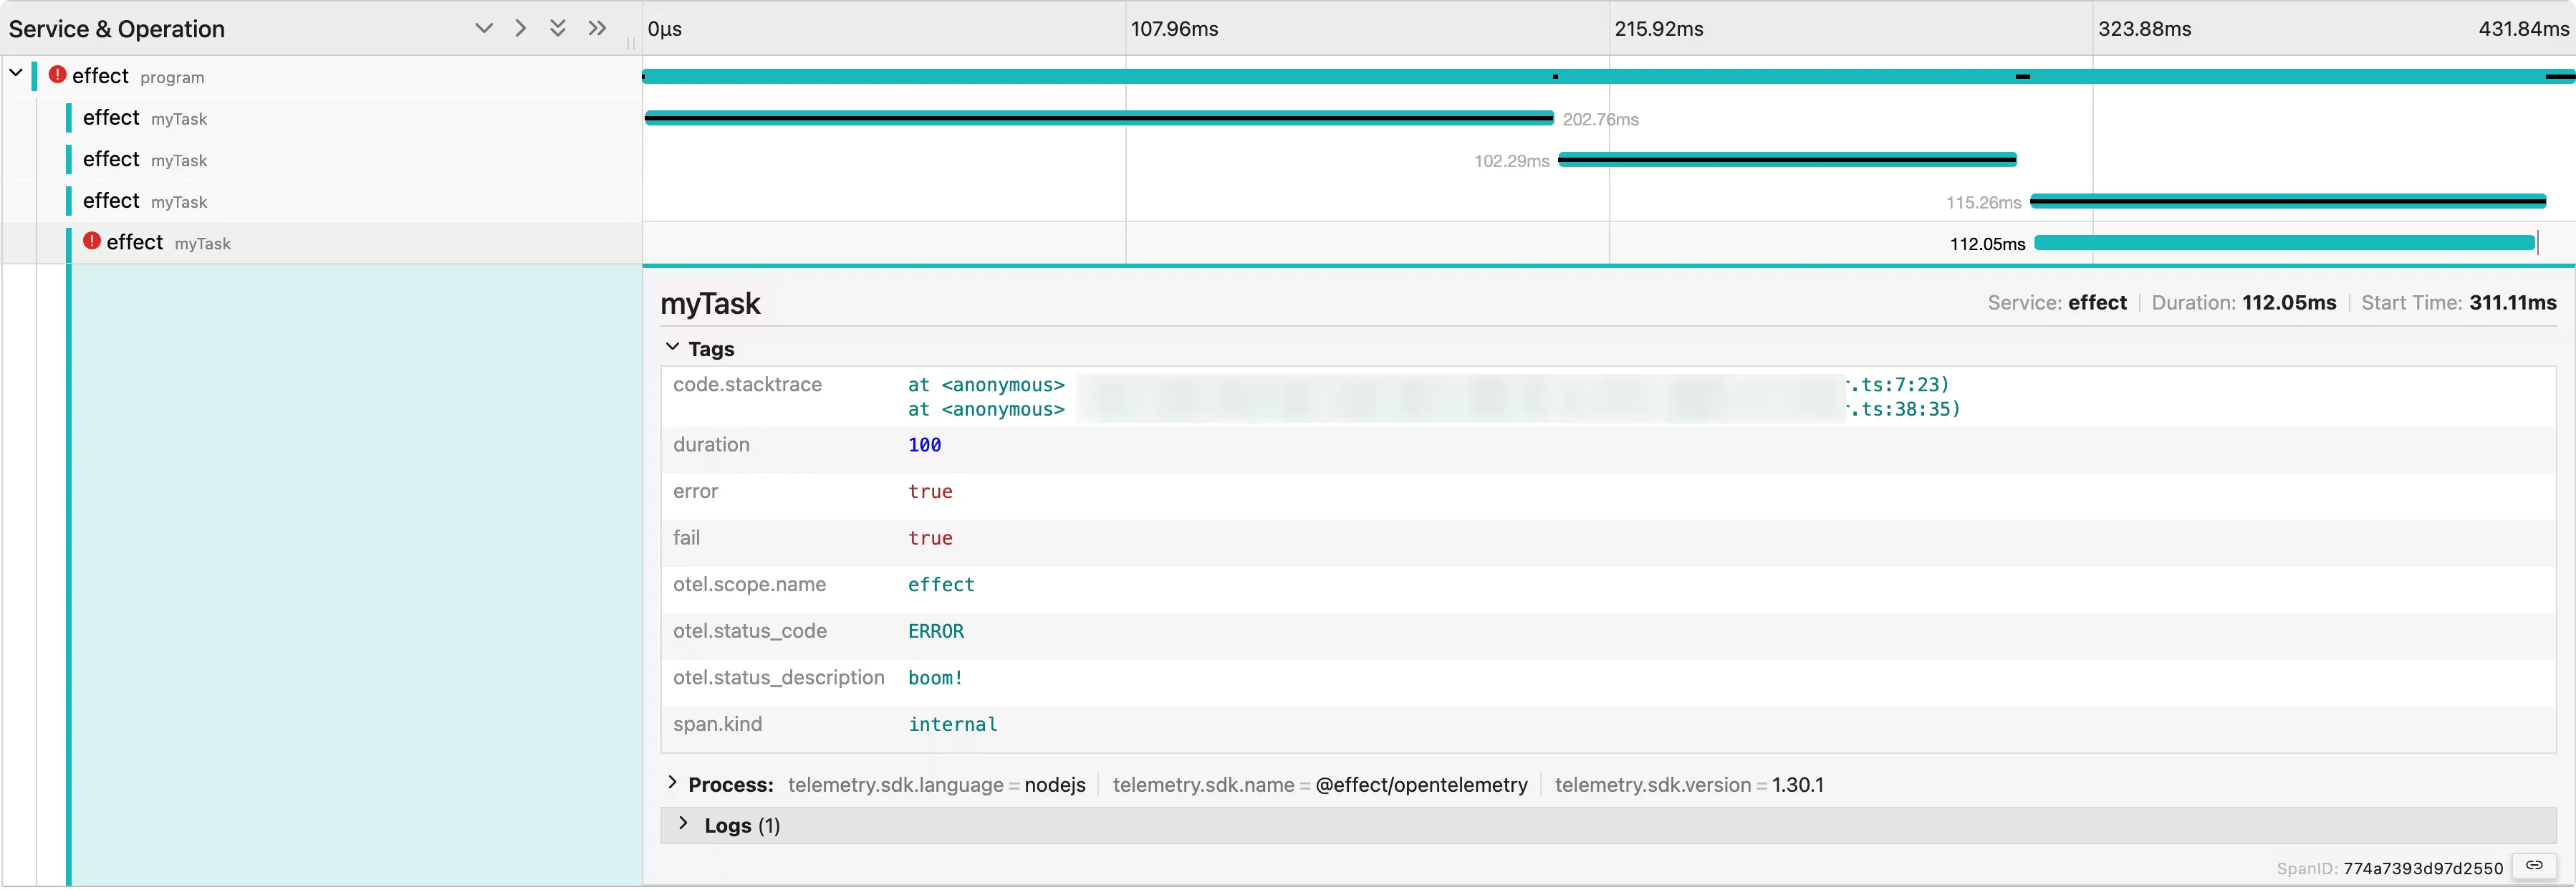
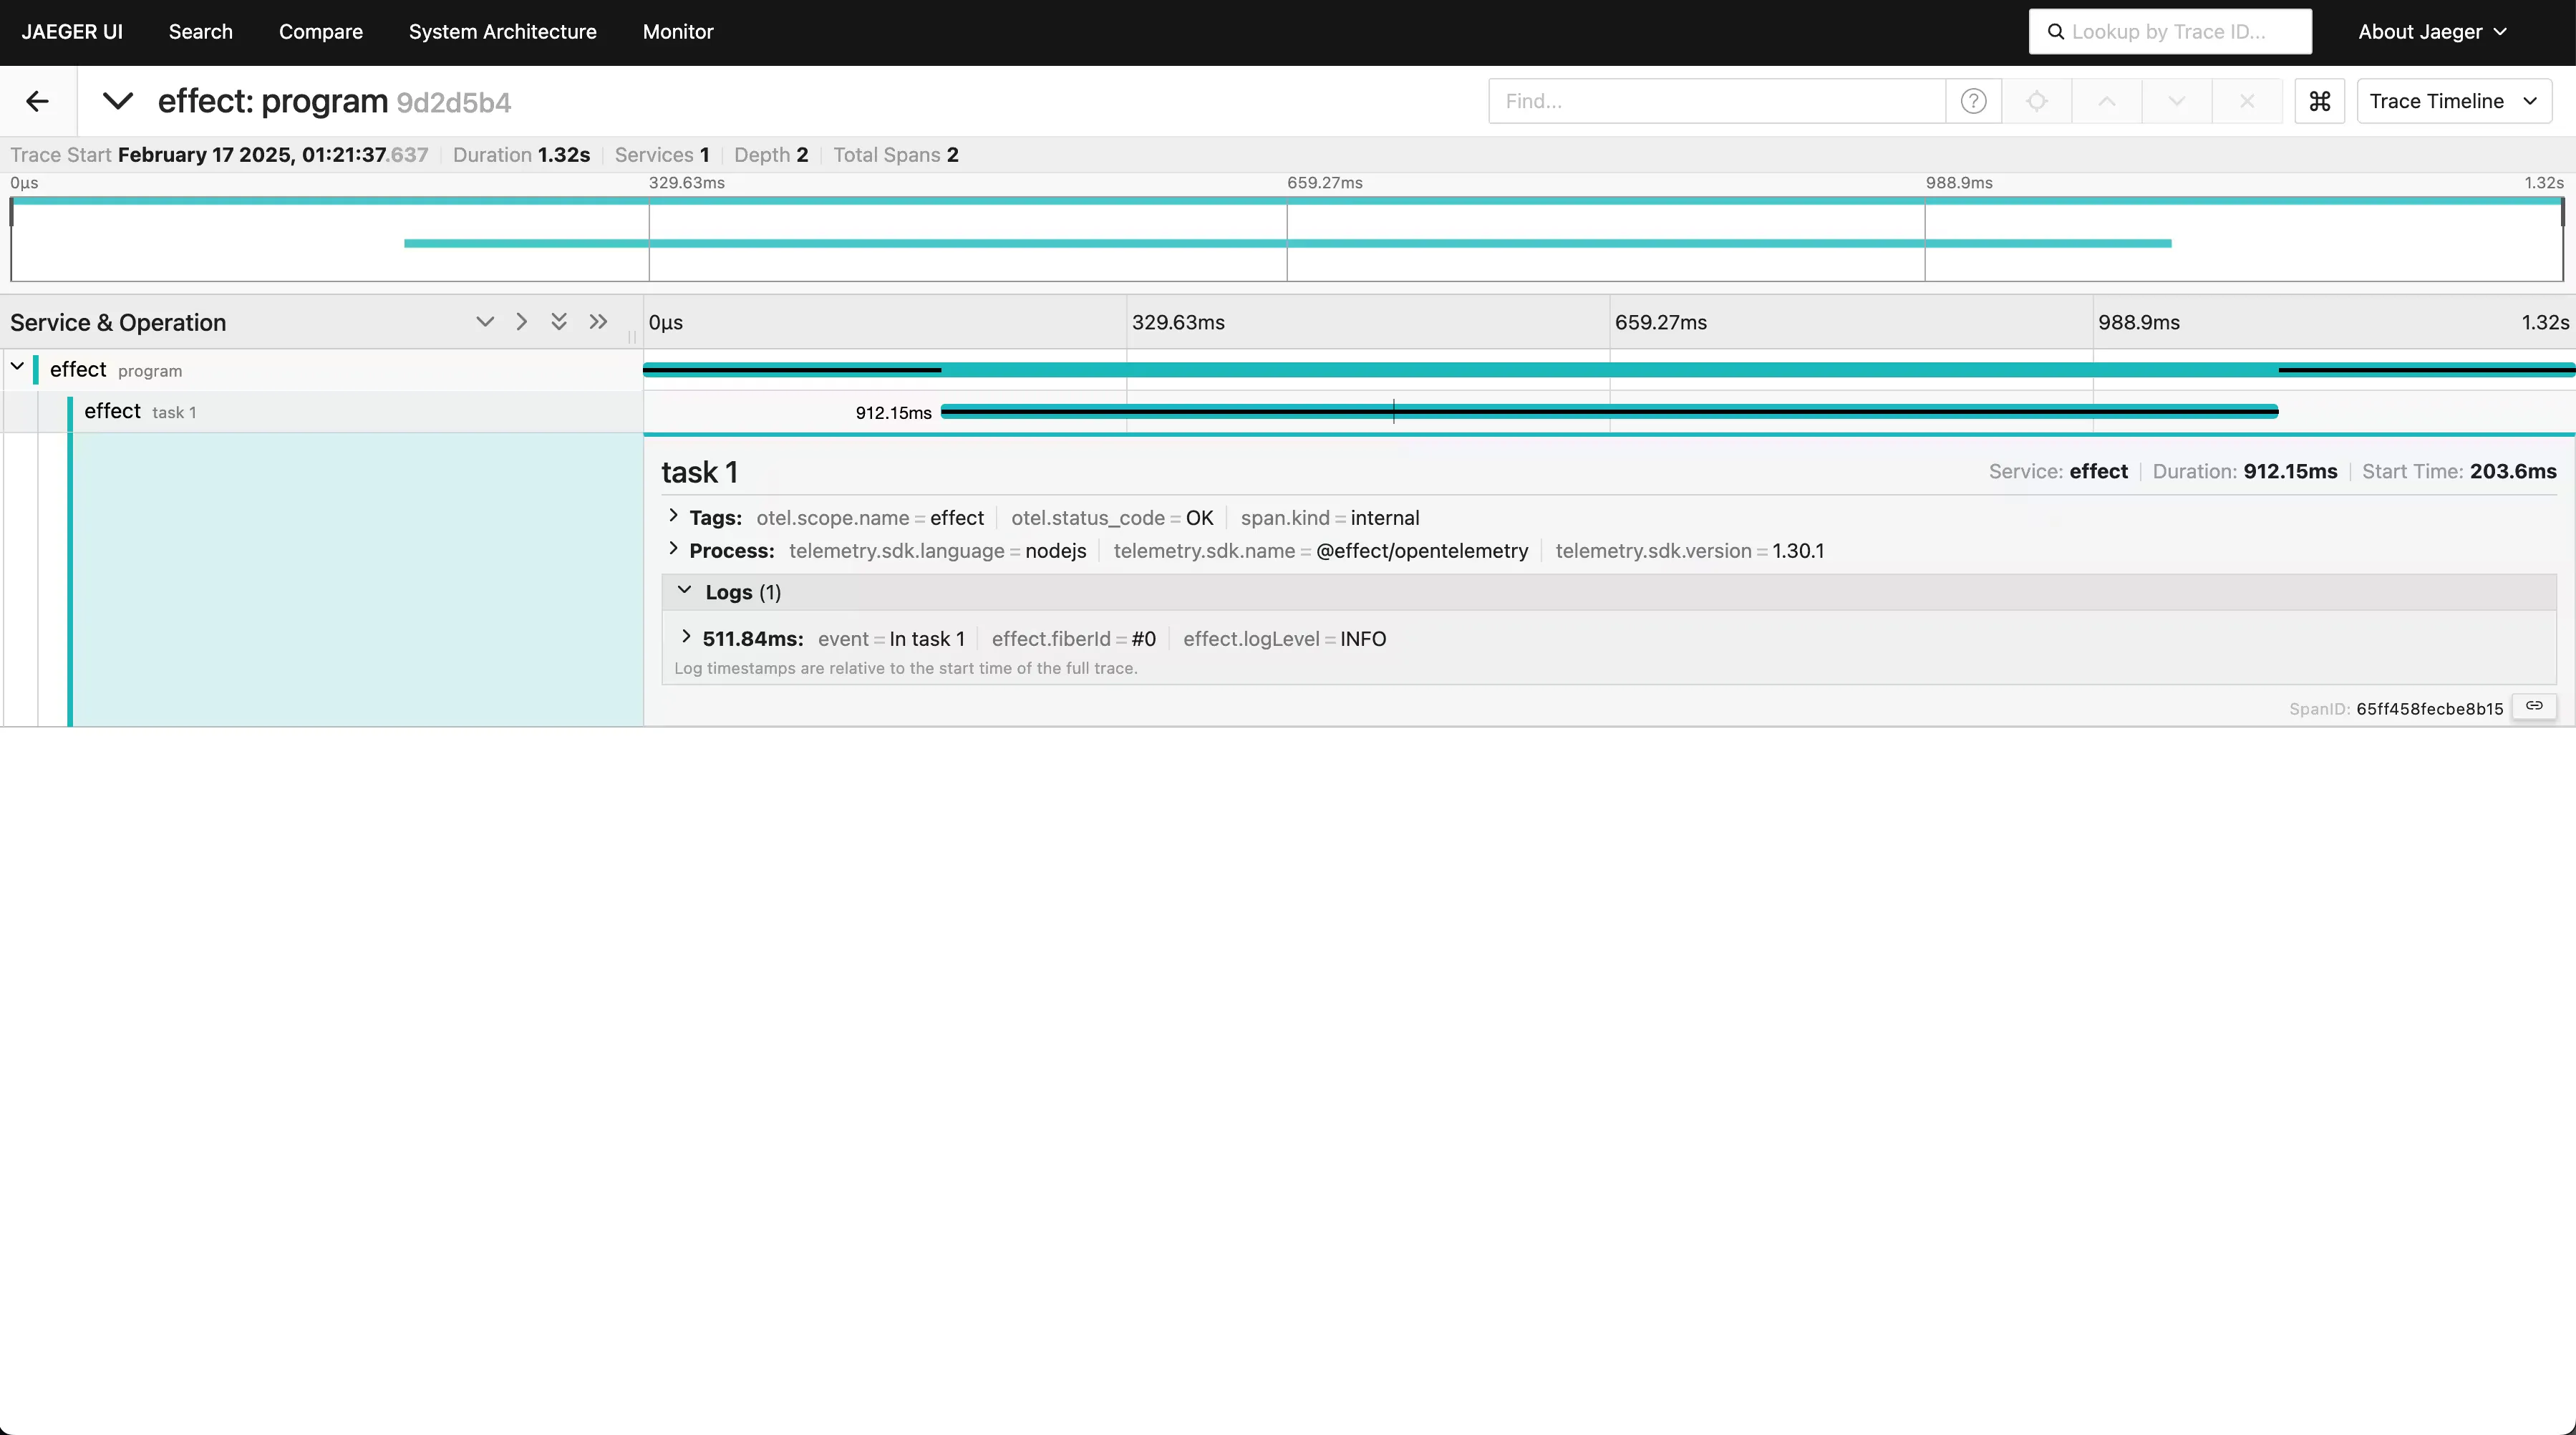
Notice how our “myTask” invocations are wrapped in spans without explictly
calling Effect.withSpan, and the failed effect is clearly indicated. Effects
that fail are always distinguished in the trace visualizer with an error
indicator and a stacktrace attribute, though spans created by Effect.fn
receive a
more detailed stacktrace
to narrow down where the error originated.
Traces
A trace represents a collection of spans. Traces are implicitly created when creating spans—any top-level span will be represented as a trace. The following program produces 3 traces, because each repetition of the span occurs at the top-level.
      const program = Effect.sleep("1 second").pipe(
	Effect.withSpan("foo"),
	Effect.schedule(Schedule.recurs(3)),
)
A trace should represent some bounded unit of work, generally some form of “request” with a clear start and end point. It depends on the app you’re building what this means exactly, just don’t have a single trace for the entire lifetime of a long-running program.
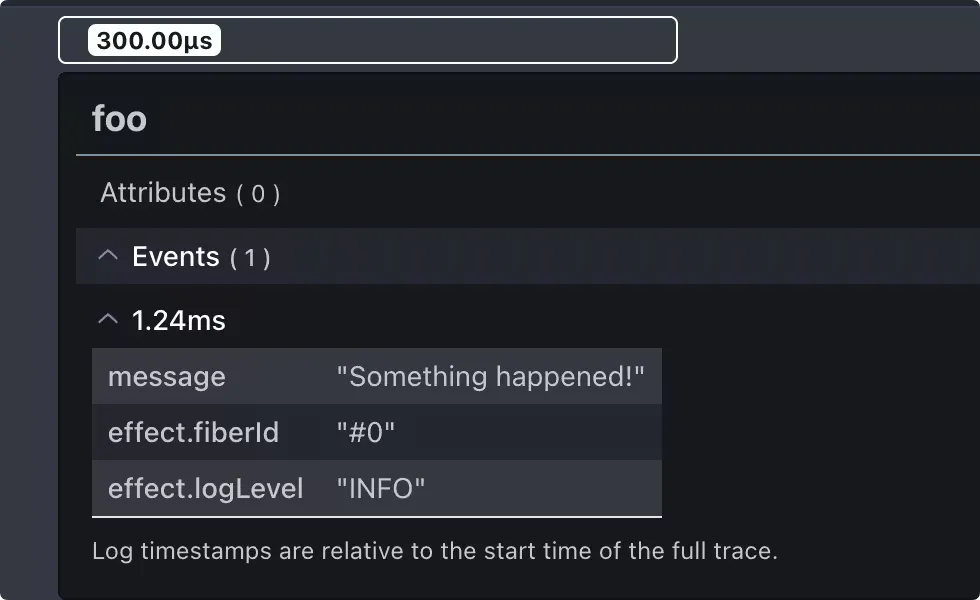
Events
Anything you log with Effect.log will automatically be captured as an event on
the current span. Most often this is all you’ll need to track events.
Effect.log("Something happened!").pipe(Effect.withSpan("foo"))
I was curious though—what if I want to track an event without logging it to the console? For example, logging chunks of LLM output that would otherwise clog up the console.
I assumed Effect.logTrace would achieve this. The description states:
This function logs the specified messages at the TRACE level. TRACE logs are typically used for very detailed diagnostic information. These messages are not displayed by default. To view them, you must adjust the logging configuration by setting the minimum log level to
LogLevel.TraceusingLogger.withMinimumLogLevel.
However, the log level not only impacts whether the logs are displayed in the console, but also whether they’re traced.
Instead I was able to suppress the printed logs by
replacing the default logger
for Logger.tracerLogger
      // `Effect.log` will only appear in traces
const addTracerLogger = Logger.replace(
	Logger.defaultLogger,
	Logger.tracerLogger,
)

// For effects
program.pipe(Effect.provide(addTracerLogger))

// For streams
stream.pipe(Stream.provideLayer(addTracerLogger))
If you don’t want to use Effect.log as the mechanism for tracing events, you
can also trace events manually by calling Span.event(), accessing the current
span on Effect.currentSpan and the bigint start time on
Clock.currentTimeNanos. I pipe this into Effect.ignore so it ignores the
case when no span is active, following the pattern I saw in
Effect.annotateCurrentSpan
.
      function addCurrentSpanEvent(
	name: string,
	attributes?: Record<string, unknown>,
) {
	return Effect.gen(function* () {
		const currentSpan = yield* Effect.currentSpan
		const currentTimeNanos = yield* Clock.currentTimeNanos
		currentSpan.event(name, currentTimeNanos, attributes)
	}).pipe(Effect.ignore)
}
Propagating and linking spans
This is more of an advanced use case, but if you want to monitor work that’s distributed across multiple machines (e.g. multiple backend services) you can serialize/deserialize metadata about a span and reference it elsewhere, either with the usual parent/child relationship or span links.
This part took me a while to wrap my head around, because the APIs expect you to
have a reference to the other span object when linking the two. In my head a
span was some complex in-memory structure, and I couldn’t find a straighforward
way to serialize and deserialize it. I got hints online that it had something to
do with
context
but I didn’t see a clear way to access that from Effect’s Tracer module. This
confusion was partly because there’s two Tracer modules,
one from the “effect”
package and
one from “@effect/opentelemetry’.
The most idiomatic approach seems to be to use the @effect/opentelemetry
tracer:
- In the sender, get the serialized
spanContext()from Tracer.currentOtelSpan - In the receiver use Tracer.makeExternalSpan to deserialize the context into a span object, then pass that into Effect.linkSpans or Effect.withParentSpan as needed, or Tracer.withSpanContext directly
      import { Tracer } from "@effect/opentelementry"

const program = Effect.gen(function* () {
	const span1Context = yield* Effect.sleep(100).pipe(
		Effect.flatMap(() => Tracer.currentOtelSpan),
		Effect.map((span) => span.spanContext()),
		Effect.withSpan("span1"),
	)

	// ...later, potentially in another process

	const span1 = Tracer.makeExternalSpan(span1Context)

	yield* Effect.sleep(100).pipe(
		Effect.withSpan("span2"),
		Effect.linkSpans(span1),
	)
})
The above program produces 2 traces, with “span2” linking to “span1”. Here, the linked span is easily available in scope so encoding isn’t necessary, but you could imaging sending that encoded span over the network or persisting it in a database to link between processes.
For HTTP requests in particular, there’s HttpTraceContext.toHeaders and HttpTraceContext.fromHeaders to assist in encoding and decoding of spans from the regular Tracer module.
      import { Effect, Tracer } from "effect"
import { HttpTraceContext } from "@effect/platform"

const program = Effect.gen(function* () {
	const span1Headers = yield* Effect.sleep(100).pipe(
		Effect.flatMap(() => Effect.currentSpan),
		Effect.map((span) => HttpTraceContext.toHeaders(span)),
		Effect.withSpan("span1"),
	)

	// ...later, potentially in another process

	const span1 = HttpTraceContext.fromHeaders(span1Headers).pipe(
		Option.getOrThrow,
	)

	yield* Effect.sleep(100).pipe(
		Effect.withSpan("span2"),
		Effect.linkSpans(span1),
	)
})
I think it’s also possible to encode/decode this yourself with Tracer.externalSpan
      import { Effect, Tracer } from "effect"

const currentSpanEncoded = Effect.currentSpan.pipe(
	Effect.map((span) => ({
		spanId: span.spanId,
		traceId: span.traceId,
		sampled: span.sampled,
	})),
)

const program = Effect.gen(function* () {
	const span1Encoded = yield* Effect.sleep(100).pipe(
		Effect.flatMap(() => currentSpanEncoded),
		Effect.withSpan("span1"),
	)

	// ...later, potentially in another process

	const span1 = Tracer.externalSpan(span1Encoded)

	yield* Effect.sleep(100).pipe(
		Effect.withSpan("span2"),
		Effect.linkSpans(span1),
	)
})
I’m just not certain about the sampled and context fields, so I trust the
built-in serialization functions more.
For further help with tracing in Effect, check out the #opentelemetry channel in the Effect Discord server. Happy tracing!